Project represents automatic metagraph visualization based on the principles of force-directed
algorithms.
Also you can create your own metagraph with this tool.
Definition . Metagraph is a construct S = <V, M, E>, where
V - set of metagraph vertices,
M - set of metavertices,
E - set of edges.
Metavertex is a vertex that includes some other vertices that called inner vertices for
this metavertex.
Metagraph node is a vertex or a metavertex.
Metagraph edge is oriented pair of vertices e(mv_out, mv_in),
where mv_out - tail, mv_in - head.
The graphical representation is calculated and placed inside the rectangular area.
The graphical representation is correct if it corresponds to the analytical.
The node have incorrect coordinates when it does not include in metavertex, but lies in figure of this
metavertex.
That nodes are marked in red.
Example
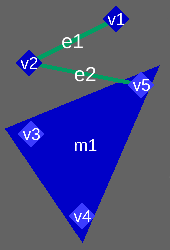
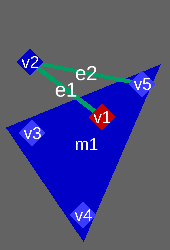
Metagraph Analytical representation
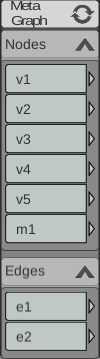
V = { v1, v2, v3, v4, v5 }
M = { m1 }, where m1 = { v3, v4, v5 }
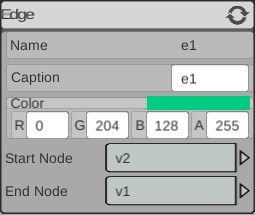
E = { e1, e2 }, where e1 = (v1, v2), e2 = (v2, v5)
Picture of incorrect graphical representation shows example when analytical representation
doesn't correspond to the graphical representation:
v1 does not include in m1, but at the picture it does.
Correct graphical representationIncorrect graphical representation
Instruction
Description of buttons
Navigates (selects) to the metagraph's element (node or edge).
Clears the area by deleting all elements of the metagraph.
Shows panel for the metagraph text representation.
Represents the metagraph in the text.
Generate the metagraph from the text. Note.Existed metagraph will be deleted.
After clicking on this button, each click on the area will create a new node with
coordinates of the pointer.
Click on the button again to stop creating nodes.
To create an edge:
1) select first node;
2) click this button;
3) select second node.
To include a vertex in a metavertex:
1) select a vertex;
2) click this button;
3) select a metavertex. Note. You can not include a metavertex in a metavertex. Only - a vertex in a
metavertex.
Also, you can not include a vertex to another vertex that has included already.
To exclude a vertex from a metavertex:
1) select a vertex;
2) click this button;
3) select a metavertex that includes the selected vertex.
To delete a metagraph's element (node or edge) select it and click this button.
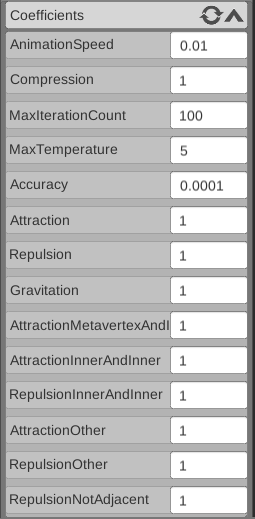
Starts the graph visualization process (new coordinates of nodes are calculated). Note.This process may take some time, because the complexity of the visualization
algorithm O(n2).
Shows configuration panel for visualization or randomization.
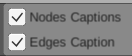
Shows or hides captions of nodes/edges.
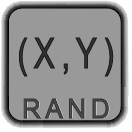
Generate new random metagraph. Note.Existed metagraph will be deleted.
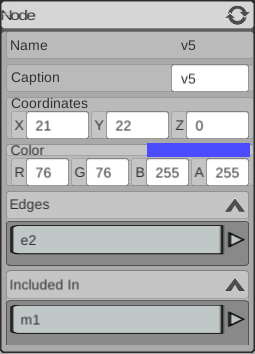
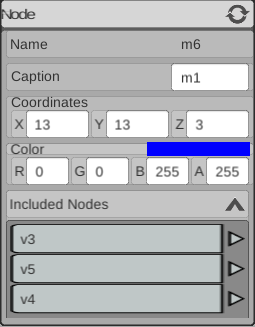
Description of a particular node: caption (coordinates) {included nodes};
(example of vertex description: v1 (19, 32, 0) {};)
(example of metavertex description: m1 (13, 14, 3) {v3, v4, v5};)
Description of a particular edge: caption (mv_out_Caption, mv_in_Caption)
(example: e1 (v1, v2);)
Panels
Panels are designed to display and edit the properties of tool's objects and configurations.
Demonstrates the properties of the vertex.
Demonstrates the properties of the metavertex.
Demonstrates the properties of the edge.
Demonstrates all elements of metagraph (nodes and edges).
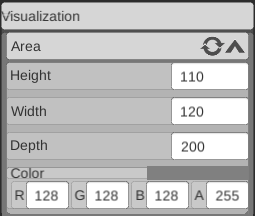
Demonstrates the configuration for visualization area.
Demonstrates the configuration for visualization area.
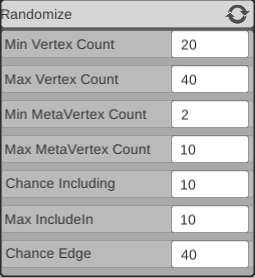
Demonstrates the configuration for generate random metagraph.


 Represents the metagraph in the text.
 Generate the metagraph from the text. Note.Existed metagraph will be deleted.